By Javvad Malik and Chris Doman
This is the third of a three-part series on trends identified by AlienVault in 2017.
Part 1 focused on exploits and part 2 addressed malware. This part will discuss threat actors and patterns we have detected with OTX.
Which threat actors should I be most concerned about?
Which threat actors your organization should be most concerned about will vary greatly. A flower shop will have a very different threat profile from a defense contractor. Therefore below we’ve limited ourselves to some very high-level trends of particular threat actors below- many of which may not be relevant to your organization.
Which threat actors are most active?
The following graph describes the number of vendor reports for each threat actor over the past two years by quarter:
For clarity, we have limited the graph to the five threat actors reported on most in OTX. This is useful as a very rough indication of which actors are particularly busy.
Caveats
There are a number of caveats to consider here. One news-worthy event against a single target may be reported in multiple vendor reports. Whereas a campaign against thousands of targets may be only represented by one report.
Vendors are also more inclined to report on something that is “commercially interesting”. For example, activity targeting banks in the United States is more likely to be reported than attacks targeting the Uyghur population in China. It’s also likely we missed some reports, particularly in the earlier days of OTX which may explain some of the increase in reports between 2016 and 2017.
The global targeted threat landscape
There are a number of suggested methods to classify the capability of different threat actors. Each has their problems, however. For example – if a threat actor never deploys 0-day exploits do they lack the resources to develop them, or are they mature enough to avoid wasting resources unnecessarily?
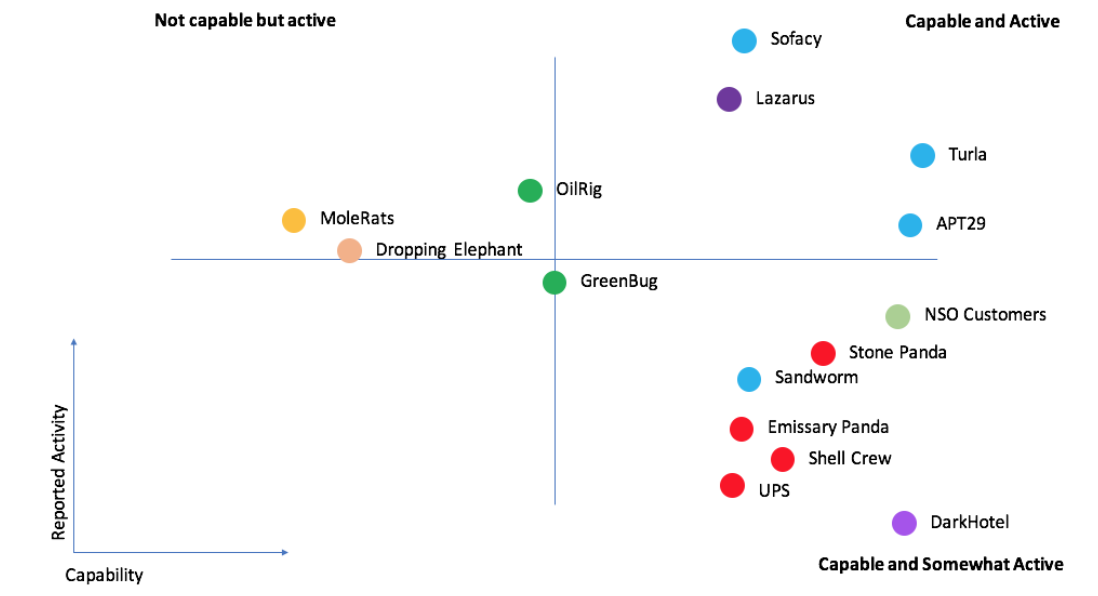
Below we have plotted out a graph of the threat actors most reported on in the last two years. We have excluded threat actors whose motivation is thought to be criminal, as that wouldn’t be an apples to apples comparison.
Both the measure of their activity (the number of vendor reports) and the measure of their capability (a rough rule of thumb) are not scientific, but can provide some rough insights:

A rough chart of the activity and capability of notable threat actors in the last year
Perhaps most notable here is which threat actors are not listed here. Some, such as APT1 and Equation Group, seem to have disappeared under their existing formation following from very public reporting. It seems unlikely groups which likely employ thousands of people such as those have disappeared completely. The lack of such reporting is more likely a result of significantly changed tactics and identification following their outing. Others remain visibly active, but not enough to make our chart of “worst offenders”.
A review of the most reported on threat actors
The threat actor referenced in the most reports in 2017 is unsurprisingly Sofacy (a.k.a Fancy Bear / APT28). Ten years ago they were mostly targeting NATO and defense ministries. In the last three years, their operations have expanded rapidly, targeting tens of thousands of organizations and individuals. Their target list includes everyone from the Russian punk band Pussy Riot to recent elections in the United States and France. An official report by the German government and a leaked report from the United States government indicate the attackers may be a part of Russian military intelligence.
The second highest ranked group are Lazarus. They are thought to operate from North Korea and are extremely active - however, the vast majority of their activities are focused solely against South Korea.
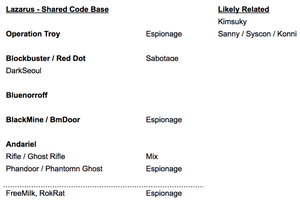
Lazarus likely consist of a few different sub-groups of attackers sharing the same code-base and are so often reported under the same name. This means the count of their activity may be somewhat over-reported:

One possible grouping of the different groups within the wider Lazarus activity, taken from a private report by AlienVault.
It’s notable that highest ranked group operating out of China (Stone Panda / APT10 / CloudHopper) comes in at only number 10. That would have been very different three years ago.
One explanation is the reported significant decrease in the number of targeted attacks from threat actors located in China against private sector organizations in the West. This followed political pressure and agreements to stop such attacks.
It is also likely a result of their attacks becoming more difficult to detect. CloudHopper are notable for compromising their targets by moving through the compromised infrastructure of many of the largest managed IT service providers.
Such methods of entry are difficult to detect for vendors focused at network perimeters. They could even prove difficult to detect for governments relying upon traffic taps. This filters down into reporting statistics. If fewer intrusions are detected, fewer organizations are told they are compromised. And then fewer are intrusions are investigated and fewer intrusions are recorded in public reporting.
We may continue to see reported activity from groups located in China drop further. UPS (A.K.A Boyusec / APT3) switched from targeting the West to primarily domestic targeting a year ago. Probable members of the team have since been indicted by the FBI and it’s likely they will go further under the radar in response.
Anunak/ Carbanak are the only threat actor with a primary motivation of criminal economic gain in our top five. This may be as groups of attackers focusing on espionage are more easily tied together, their attacks are more newsworthy, and their attacks can resemble more discretely delineated campaigns. As a result organized criminal groups, such as those behind some of the Dridex botnets, are underreported here.
The Anunak toolset is likely shared between a small number of groups, and has been rarely seen in espionage as well as criminal profit.
The reports on OilRig are primarily the result of the interest in the threat actor by individual researchers at Clearsky Security and Palo Alto Networks.
Turla win our “life-time achievement” award, for continuing to be very active despite their first attacks being recorded way back in the 1990s. They are notable for their usage of satellites to perform command and control.
Sharing is caring
We can also use OTX data to graph the number of reports by each vendor. For the top five vendors by number of reports it looks like this:
There are seasonal variations in some attackers - such as those trying to hit their annual targets. However, those in the number of reports above are more likely to be timed around large conferences where reports are often launched.
This isn’t meant as a measure of quality of other vendors (AlienVault doesn’t come in the top 5 in terms of raw numbers!) and some vendors (eg; Cisco Talos) have been particularly busy in the last year but aren’t featured as we counted total reports since 2015 in this graph.
Conclusions
No statistics can provide insight into trends on their own, but we hope we have provided insights into where defenders should prioritise their resources.
We’re seeing old exploits, threat actors and malware persist. The good news is that means we should have time to adapt, the bad news is their continuing success comes from our failure to prevent it.
We’re looking forwards to seeing threat intelligence sharing programs like the Open Threat Exchange to highlight these threats, and would welcome further work to see if others have different findings.
Appendix
We’ve shared both the raw data for this analysis, and the scripts we used to build this data-set from OTX, are available on GitHub.

