| Applies to Product: |
|
|
The first menu selection of the USM Appliance web UI that plays a large part in security monitoring and analysis of a network environment is the Dashboards menu. It provides overall visibility into the activity on your network, and displays various network security metrics.
Dashboards Overview
When you first log in to the USM Appliance web UI, it opens the Dashboards > Overview page.

Note: The OTX Activity widget will only contain data when the suspicious IP is reported as an IOC for a pulse. See OTX Pulses and Indicators of Compromise and Displaying Alarms and Events Based on OTX Pulse and IP Reputation for details.
The default Overview > Executive display shows various “widgets” (charts, tables, and graphs) that summarize various aspects of network security and other status, activities, and events occurring in your network. Additional options from the Overview page provide dashboard displays for Tickets, Security, Taxonomy, and Vulnerabilities.
- Tickets — Provides metrics on tickets created within USM Appliance’s own ticketing system.
- Security — Provides metrics on different measures of security in the environment, for example, promiscuous host, active hosts, most frequent alarms, and security event reporting trends.
- Taxonomy — Provides metrics on events based on different USM Appliance taxonomy event classifications, for example, virus detection, successful and failed logins, malware, and exploit event types.
- Vulnerabilities — Provides metrics on vulnerability characteristics such as severity and most affected hosts. Also displays details of available scan reports.
Each widget on the dashboard provides its own representation of information along with a legend or description of data points. For most dashboard displays, you can mouse over or click through portions of the display to view the data on which the dashboard display was rendered. Clicking on the icon provides a more detailed explanation about the information the widget displays. For more information about the dashboard, see USM Appliance Dashboard Configuration.
The Environment Snapshot is displayed on the far right side of the USM Appliance web UI. The default state shows the current alarms and the Events Per Second (EPS). You can expand the Notification Tray to view the Environment Snapshot by clicking on the small arrow on the left side of the summary Environment Snapshot display.

The Environment Snapshot shows open tickets, unresolved alarms, system health, latest event activity, and the number of monitored devices.
In addition to the Overview display, the main Dashboards menu selection also provides several other submenu selections:
- Deployment Status — Provides a global view of monitoring in place for assets, networks, and locations. In addition, you can define locations and then add USM Appliance Sensors to monitor and view monitoring in place (such as IDS, vulnerability scan, NetFlow monitoring) for different network devices and servers at a specific location.
- Open Threat Exchange — Allows you to visualize threats graphically in a map, as well as list OTX Pulse information. The map visualizes IP addresses that belong to hosts that are performing attacks or have malicious behavior. These IP addresses are provided by Indicators of Compromise which are included as part of OTX pulses.
Deployment Status
To take a closer look at the deployment status of all your networks and assets, go to Dashboards > Deployment Status.
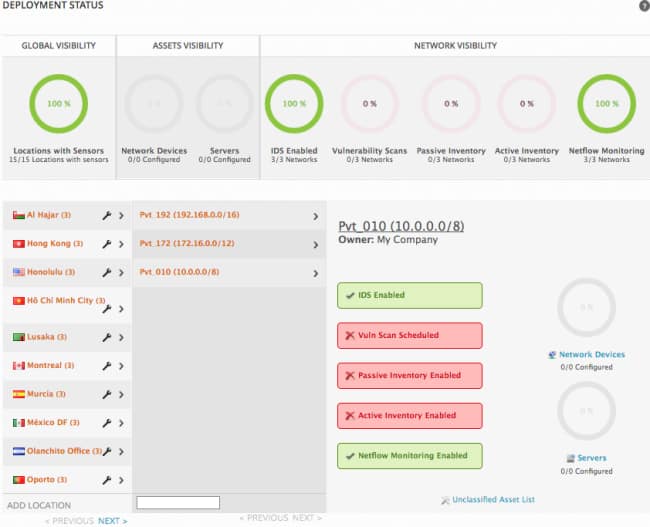
Here you can see an overview of global visibility, assets visibility, and network visibility at the top of the page. Global visibility lists how many locations are in your environment, and how many of them have sensors deployed. Assets visibility lists the total number of network devices (such as modems, hubs, switches, and routers) and servers in your environment and whether or not they've been configured in USM Appliance. Network visibility displays how many individual networks have IDS enabled, NetFlow monitoring, and how many have scheduled inventory and vulnerability scans.
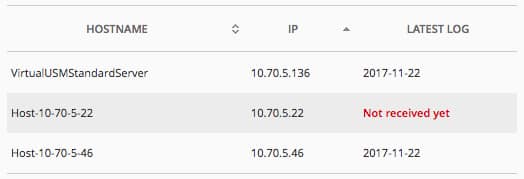
In the network view, click the Unclassified Assets List link at the bottom of the network view pane to define any unclassified assets. Click on Network Devices or Servers links to see individual details about which assets are configured and when the latest log was created for that asset.
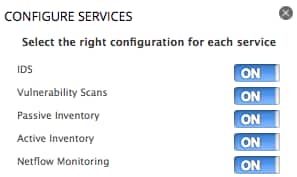
Below the header, you can also explore the individual locations and the networks on them. You can click the settings icon (![]() ) to configure network services for the network.
) to configure network services for the network.
 Feedback