| Applies to Product: |
|
|
When investigating alarms, you may find it helpful to check whether there are any related events in the SIEM database that were not included in the alarm. For example, you could search for events that came from the same host as offending traffic triggering an alarm.
Most of the time, however, you can do one of the following to view events:
- From the Analysis > Alarms, access events that triggered the alarm by clicking the alarm in the Alarms list > View Details and clicking any related event in the Events list, located at the bottom of Alarm Details.
- From Analysis > Security Events (SIEM) > SIEM, search on events with specific criteria in mind, such as source and destination, a particular sensor or other relevant asset. See Security Events Views for details.
USM Appliance, complements the collection of regular security events and alarms with anomaly events. USM Appliance uses the log information collected from Identity Management (IDM) plugins and agent software to track the value of specific host attributes and generate anomaly-type events when those values change.
Examine Alarms and Security Events
In this procedure, we describe the first and most straightforward method of investigating the trigger for a specific alarm.
To get information on events that triggered an alarm
-
Go to Analysis > Alarms and click the alarm within the Alarms list whose events you want to research.
This could be based on the Alarm intent or some other factor.
- Click View Details.
-
On Alarm Details in the Events list at the bottom of the page, click one of the related events.
The Event Details view displays.
This view provides as many details as USM Appliance knows about the event, including its risk, reliability and priority.
Depending on the event, the Event Details may include
- An attack payload description.
- Rule detection details if a particular correlation rule flagged the event.
- A concise view of the Raw Log.
- To see more details, click View More.
- Examine information on the event (Review Event Details). For example, find out more about an involved source or destination IP address by clicking the respective IPs in the Source or Destination sections of the page.
-
If one of your assets was involved with an alarm, get more information by going to Environment > Assets & Groups > Assets ().
- If the alarm is based on an attack, verify whether or not it really affects your asset.
- Check the asset operating system and the services running on it. (This check requires you to learn what kinds of endpoints the attack targeted.)
- When examining assets, give special attention to any issues the vulnerability scan detected. If you see many vulnerabilities in an asset, examine them to determine the severity of each (Viewing the Scan Results).
-
Examine all reported alarms and events involving this asset to rule out any activity related to the alarm.
Based on the policies you configure, for example, about how USM Appliance should handle events from other tools, some events may not be stored in the SIEM database. However, the risk assessment engine still correlates them and asses risk to create alarms.
-
To locate these and to check for any patterns of questionable asset activity, review the Raw Log.
Filter and Display Anomaly Events
The USM Appliance Server displays anomaly events, along with any other security events it processes, in the USM Appliance web UI's Security Events (SIEM) display.
To filter and display anomaly events
- Select Analysis > System Events (SIEM) from the USM Appliance web UI.
- In the top Search/Filter portion of the display, select the Anomalies option in the Data Sources field.
Note: The Anomalies option will only appear if the USM Appliance Server has anomaly events to display.
The USM Appliance web UI now displays the anomaly events generated by the USM Appliance Server within the specified time frame, and meeting any other filter conditions you specified.

- To view details of a specific anomaly, click the Event Detail (
 ) icon located on the far right of an event row.
The USM Appliance web UI now displays details of the selected event.

- The anomaly event detail identifies the Anomalies Data Source Name and Data Source ID (5004). Near the bottom of the event detail display, the Last Value and New Value entries highlight the change in IDM properties that triggered the generation of the anomaly event.


To display anomaly event types
You can identify the different types of events that the USM Appliance Server will generate for changes in IDM properties by viewing the details of the Anomalies data source configuration. To do that:
- Select Configuration > Threat Intelligence from the USM Appliance web UI.
- Select the Data Source option from the main Threat Intelligence display.
The USM Appliance web UI now displays a list of all data sources or plugins that are available.
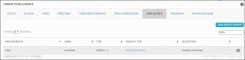
- In the Search field, type "anomalies" or "5004" (the Anomaly data source ID).
The USM Appliance web UI now displays only a single row description of the Anomalies data source.
- Click the Data Source Detail () icon.
The USM Appliance web UI now displays all the individual event types the USM Appliance Server will generate for changes detected by enabled IDM plugins.

- From this display you can set specific priority and reliability values for each type of event. You can also click the Event Type Detail () icon to change event type attributes, including the text description of the event type, and its configurable priority and reliability values.


 Feedback