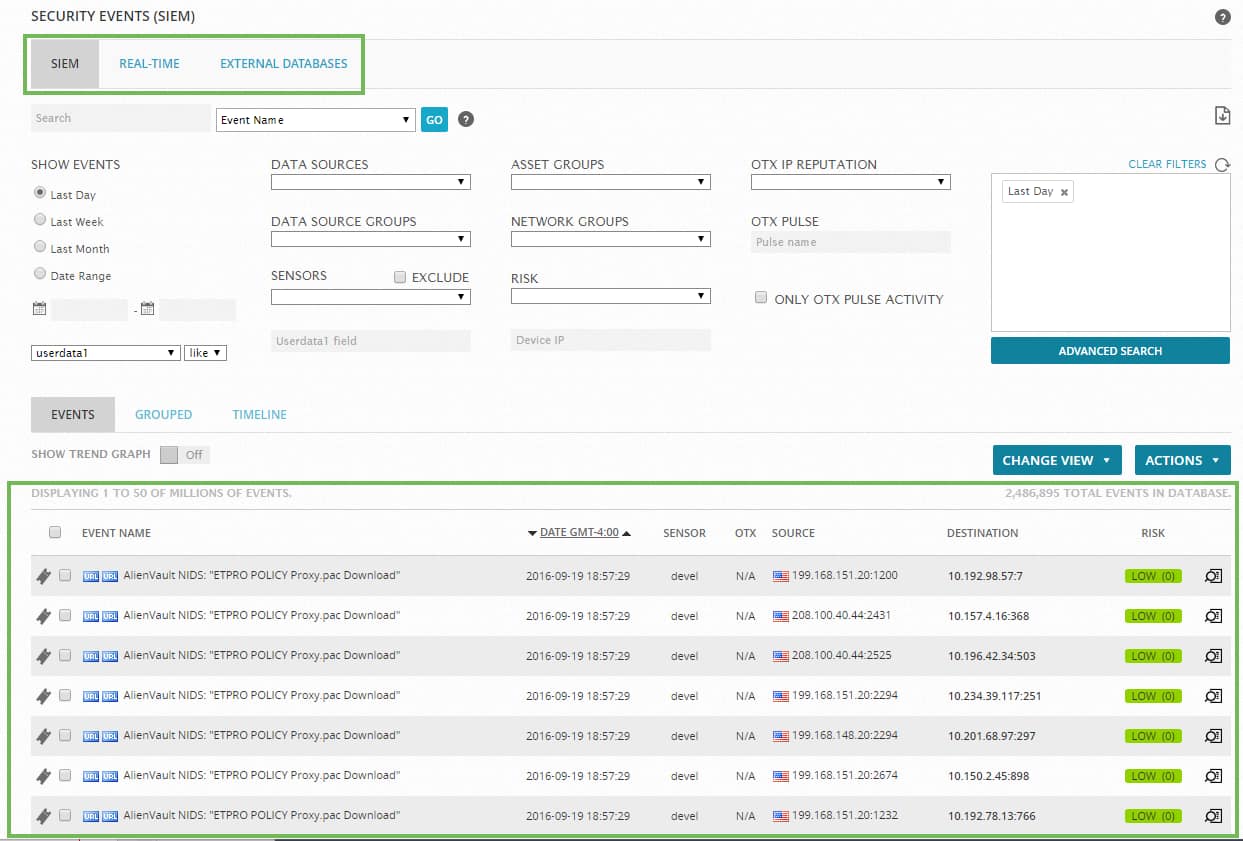
USM Appliance Server receives normalized log data called events from one or more USM Appliance Sensors, correlates and prioritizes them across all assets, and then present them in the web UI as a variety of summary and detailed views.
When you select the Analysis > Security Events (SIEM) menu option, USM Appliance displays the following page.

By default, the Security Events (SIEM) page displays a SIEM view of events. The USM Appliance web UI also provides two other options for displaying security events:
-
Real-Time
View that shows events in progress in your network.
-
External Databases
Display security events from an external LevelBlue database that is associated with a different LevelBlueUSM Appliance installation. For more information on configuring a connection to an external LevelBlue database, see How to display Security Events from an External AlienVault Database.
From the SIEM option view, you can search and filter for events using time ranges and other event attribute criteria.
Below the Search Filter section of the page, USM Appliance provides a display of all events, or filtered events (if you specified search criteria for events). Any normalized log event, or any other event received or generated by any USM Appliance Sensor at the application, system, or network level will appear in the display unless a USM Appliance policy has filtered it out or you have specified search filter criteria.
From the tabular summary listing of events, you can click on a specific event row to view further details about that event in a popup window. You can also click the ![]() icon in an event row to display event detail on a new page, which also lets you choose further actions to take with the current event.
icon in an event row to display event detail on a new page, which also lets you choose further actions to take with the current event.
 Feedback