| Applies to Product: |
|
|
In addition to monitoring and analyzing events and alarms, there are other aspects of security you will monitor and update in your network environment. The Environment menu provides access to these other areas of network security through various submenu options, which include the following:
- Assets & Groups — This option lets you view and manage assets, networks, asset groups, and network groups.
- Vulnerabilities — This option lets you view and vulnerability scanning. The vulnerability scan can run from one or more LevelBlue sensors.
- NetFlow — This option provides the ability to monitor and work with NetFlow data.
- Traffic Capture — This option allows the user to implement and manage remote traffic capture through LevelBlue Sensor. There are several capture options such as timeout, packet size, sensor name, and packet source and destination.
- Availability — You can use this option to view and configure availability monitoring.
- Detection — This option is used to manage intrusion detection for most operating systems. This option also displays log analysis, integrity checking, Windows registry monitoring, rootkit detection, time-based alerting, and active response.
- Reports — Lists all available USM Appliance reports and allows you to perform operations such as Delete, Export, Copy, Edit, Custom Run, and Run Report.
The Assets & Groups Page Display
When you select the Environment > Assets & Groups option, USM Appliance displays the following page.

The default Environment > Assets & Groups display shows a count of assets and also displays a tabular list of all assets in your network environment that were added manually or created using asset discovery (performed by network scans). You can click the Add Assets button to add assets, choosing options such as Add Host, Import from CSV, Import from SIEM, and Scan for New Assets. Selecting the checkbox next to a specific asset enables the Actions button to select operations such as running asset or vulnerability scans, deploying a HIDS agent, and enabling availability monitoring.
From the default Assets display, the left-side Search panel lets you filter the assets appearing in the asset list by selecting specific asset attributes. USM Appliance maintains an integrated inventory of assets that can store additional information about assets, in addition to information retrieved using passive and active scanning methods and tools.
Clicking on a specific asset in the tabular asset list expands the information displayed for the selected asset. This includes related information such as the number of vulnerabilities, alarms, and events pertaining to the asset.

You can also sort assets in the list by clicking on the table headings that reflect the attribute values maintained for each asset. Clicking the View Details (![]() ) icon next to an asset displays all the details recorded or tracked for that asset on a new page.
) icon next to an asset displays all the details recorded or tracked for that asset on a new page.
On the Asset Detail page, besides the name, IP address, and description of the asset, you can also see the location of the asset, plus summary and detail information for related information such as vulnerabilities, alarms, events, and so on.
In addition to the default Assets page view, the USM Appliance web UI also provides the following display options:
- Asset Groups — Displays asset information organized by asset groups defined within your network environment. In addition, you can create new groups and add assets from this view.
- Networks — Displays asset information organized by networks or subnetworks defined by your organization. In addition, you can add or define new networks or subnetworks to group assets. Assets are organized into networks based on IP addressing.
- Network Groups — Displays asset information organized by groups you define within networks or subnetworks. From this view, you can also add new network groups or modify existing ones.
- Schedule Scan — Provides options to view existing scheduled scans and schedule new asset discovery scans and WMI scans on Windows hosts.
Note: See Asset Management for a description of the other Assets page displays and more details on the operations and tasks that you can perform from the Environment > Assets & Groups menu option.
The Vulnerabilities Page Display
When you select the Environment > Vulnerabilities option, USM Appliance displays the following page.
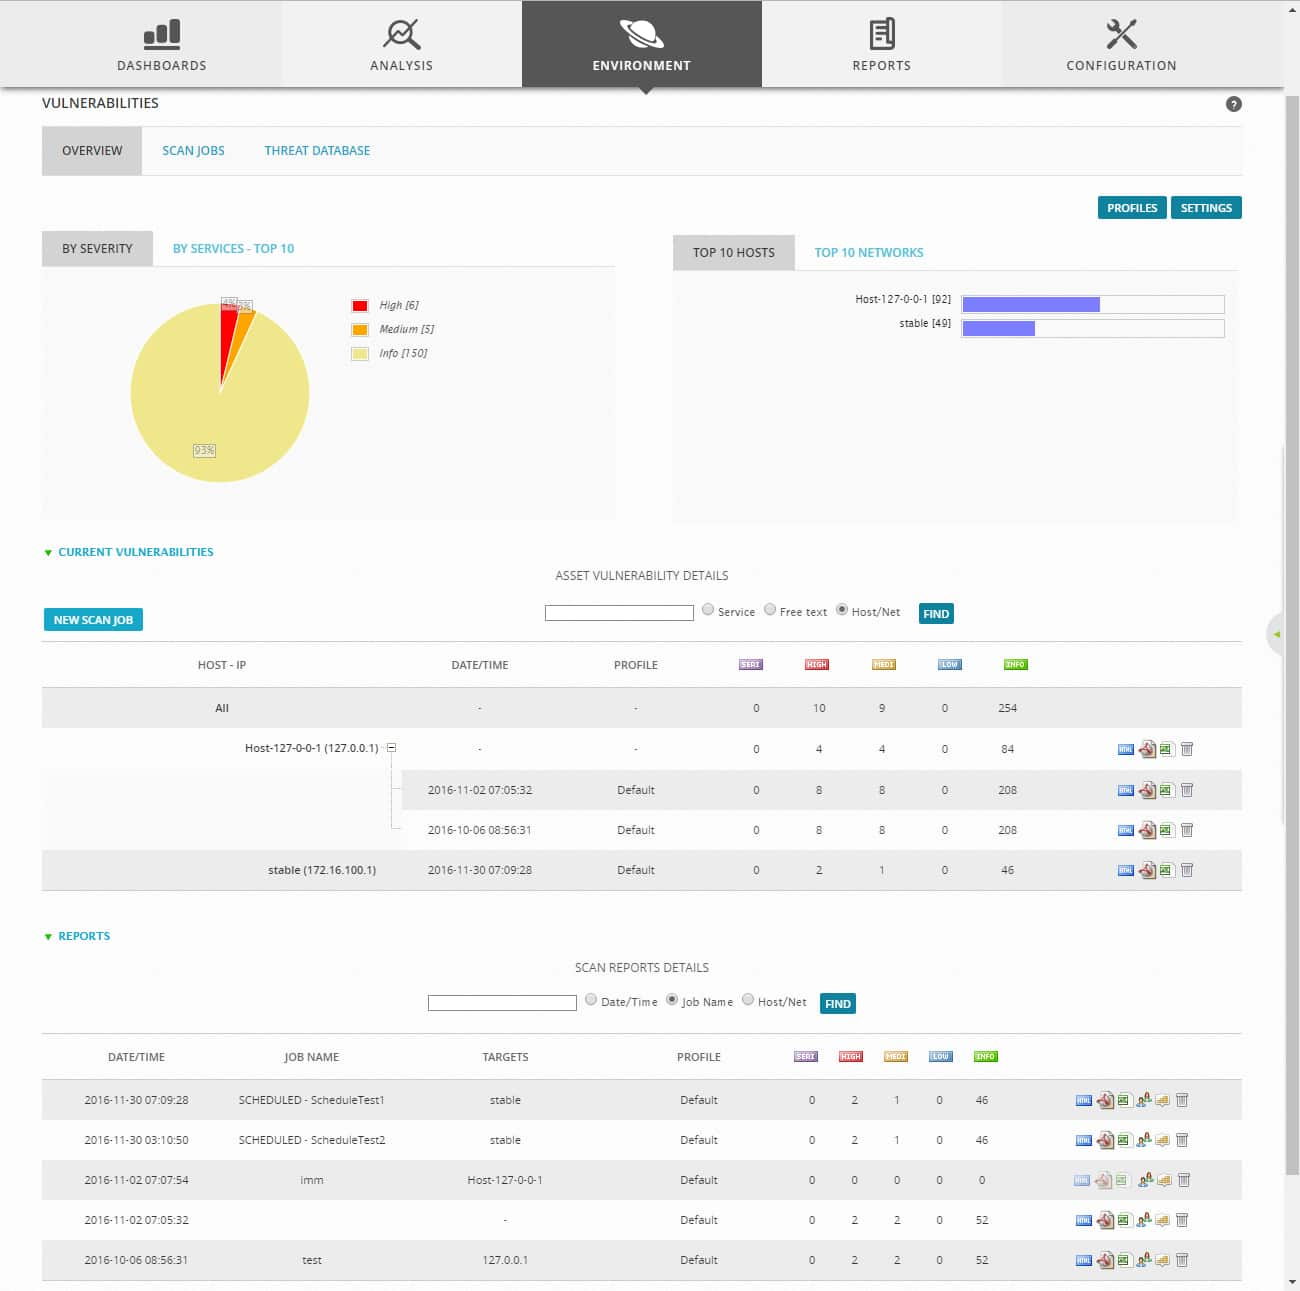
The default Environment > Vulnerabilities display charts the most important vulnerabilities in your environment, by severity and top 10 hosts, or by top 10 services or networks. From this display, you can also view results from past asset vulnerability scans (in HTML or PDF), or schedule a new scan job. In addition, you can create or edit profiles (describing type of scans that can be performed), and define or edit credentials to be used for scans (by clicking the Settings button).
In addition to the Vulnerabilities Overview display, the USM Appliance web UI also provides the following options:
- Scan Jobs — Provides capability to view scans in progress, import .NBE vulnerability assessment scan reports, and create or schedule new vulnerability scan jobs.
- Threat Database — Provides ability to search for and display current threats.
Note: For more information about threats and vulnerabilities, see Vulnerability Assessment.
The NetFlow Page Display
NetFlow is a protocol designed and published by Cisco Systems that has become the industry standard for recording information about network flows (connections between hosts using TCP/IP). USM Appliance uses NetFlow collection as a service for behavior monitoring. USM Appliance Sensors can collect NetFlow information from traffic received on mirrored ports, or network devices can send net flow information to USM Appliance.
NetFlow collection can assist in identifying insecure services, protocols and ports that are not allowed. It also can assist in identifying traffic sources and destinations to help ensure that inbound internet traffic is limited to IP addresses within the DMZ.
When you select the Environment > NetFlow option, USM Appliance displays the following page.

The default Environment > NetFlow display provides various charts, graphs, and tables to detail statistics about network flows in your environment. You can select the time frame for the NetFlow information displayed by moving sliders in the graph, or by selecting a predefined time range. You can also select NetFlow processing options and specify an additional NetFlow filter such as:
ip host x.x.x.x
NetFlow data provide information about the session traffic in your environment. Flow information typically captures session details such as the network interface, source and destination IP addresses, source and destination ports, type of service, and so on. NetFlow capture can also include information such as number of packets and bytes in flow, and packet and bit transfer speeds.
Note: For more information on using NetFlow to view network flows in your environment , see NetFlow Monitoring.
In addition to the default Details view, the USM Appliance web UI also provides the following options:
- Overview — Displays a collection of chart plotting individual NetFlow attributes such as flows and packets per second. You can click on a specific chart to display more NetFlow detail.
- Graph — Displays charts of flow and bit rates based on selection of NetFlow, packets, or traffic options.
The Traffic Capture Page Display
When you select the Environment > Traffic Capture option, USM Appliance displays the following page.
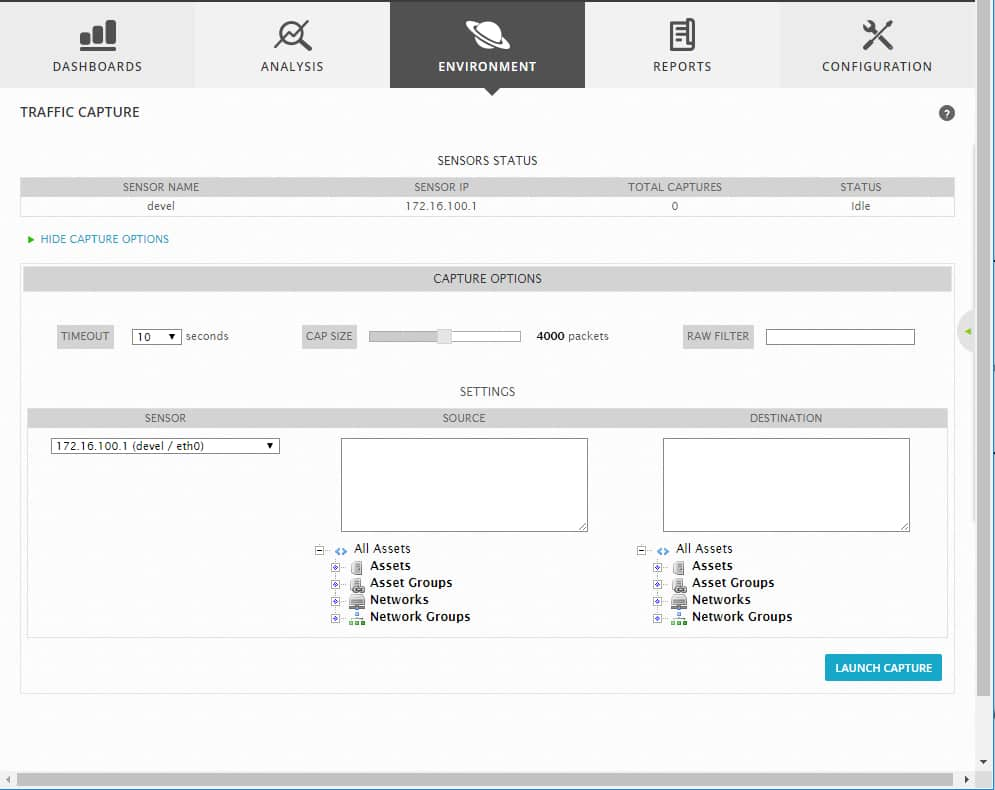
The Environment > Traffic Capture displays provides options to set up traffic capture of packets and display the results. In setting up the traffic capture, you can specify the duration of the capture (timeout), number of packets to capture, and a selection of asset source and destination addresses of the traffic.
You can click Launch Capture to begin the capture. After USM Appliance completes the traffic capture, it displays a traffic capture results page. From the traffic capture results page, you can examine the packets and choose options such as Download or View Payload to view, for example, in an external packet capture tool such as Wireshark.
Note: For more information on performing operations using the Traffic Capture option, see Capture and Examine Packets.
The Availability Page Display
When you select the Environment > Availability option, USM Appliance displays the following page.

Within the Monitoring page view, you can select various options to see status details on the localhost. You also can select options to view details such as service and host problems, network outages, downtime, and performance. The default Assets & Groups > Assets page displays status and other operational information on different servers, applications, and services running in your network environment.
In addition to the Monitoring page view, USM Appliance also provides a Reporting page view option that lets you select and generate reports for many of the same details as shown in the Monitoring view. See USM Appliance Reports .
The Detection Page Display
When you select the Environment > Detection option, USM Appliance displays the following page.

The default Environment > Detection page display provides options to manage intrusion detection for most operating systems. You can also display status and other results for intrusion detection, such as event trends, log analysis, integrity checks, Windows registry monitoring, and root kit detection.
From the default HIDS page view (Overview), you can also choose options to display HIDS status and intrusion detection configuration details for the following:
- Agents : Review and update settings for HIDS Agent Control, Syschecks, and agents.conf, or add new agents.
- Agentless : Review and update settings for agentless intrusion detection on a host.
- Edit Rules: Review and update XML rule files and individual rules for HIDS.
- Config: Review and update which XML Rules files are either enabled or disabled, set Syschecks options, and review and edit the Configuration XML file used for HIDS.
- HIDS Control: Review and set HIDS Control actions, restart HIDS services, and view HIDS and Alerts logs.
Generating Reports
While the Dashboards menu provides visibility and display of various network security metrics for your network environment, USM Appliance also provides over 200 different reports that you can schedule or generate on demand, which provide detail on various aspects of USM Appliance network security.
The Reports Page Display
When you select the Reports > All Reports menu option, USM Appliance displays the following page.
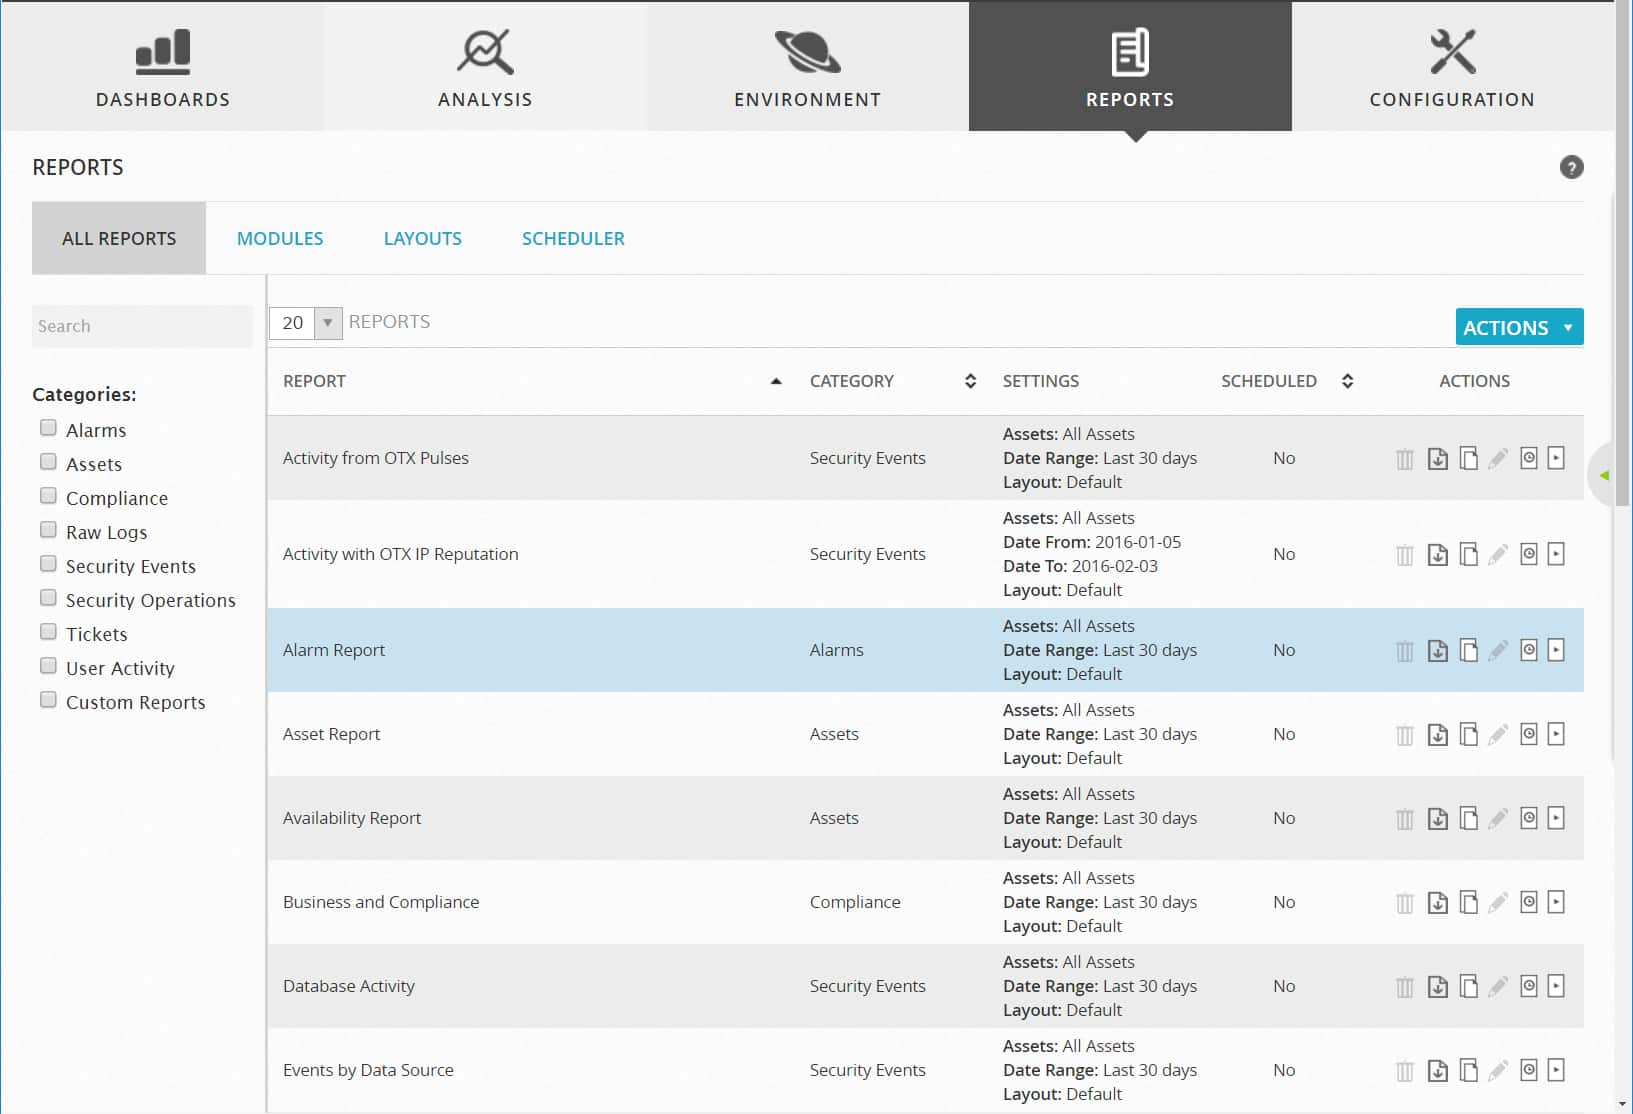
This page displays the entire collection of reports available in USM Appliance, showing the name of each report, its categories, report settings, and whether the report is scheduled to be generated. From this page, you can also select checkboxes in the left-side Search panel to restrict the display to show only those reports belonging to selected categories.
Each of these report categories is also available as a report submenu option, for example, you can select Reports > Alarms to display a list that only contains reports pertaining to Alarms.
The last column in the list of reports describes available actions for a selected report. These include Delete, Export, Copy, Edit, Custom Run, and Run Report. You can generate or run a report, on demand, or create a scheduler task to periodically run a report. After you run reports, you can save them as PDFs for printing, or distribution by email.
Clicking the Actions button provides options to create or import a new report.
In addition to the default display pages from which you can access and run reports, USM Appliance provides alternative page views for the following:
- Modules — Provides selection from over 2600 report components to be included in reports. You can define queries to retrieve data used to generate graphs and tables included in reports.
- Layouts — Provides options to define the graphical aspects of reports by defining the header and footer, color scheme, and icons that report documents will use.
- Scheduler — Provides options to specify the periodic generation of reports, also designating who can view a report and who reports are sent to.
For more information on creating reports, setting options, and running reports, see USM Appliance Reports .
 Feedback