| Applies to Product: |
|
|
The USM Appliance web user interface (or web UI) provides access to all the tools and capabilities that USM Appliance makes available for managing security of your organization’s network and computers and other devices in the network. From the USM Appliance web UI, you can view all essential information about network devices, applications, user activity, and network traffic in your environment. As you monitor information coming in from devices, you can go about defining and refining policies and correlation directives to fine tune the behavior of your USM Appliance system to alert you of potential security issues and vulnerabilities.
The USM Appliance web UI runs in a standard web browser. Your system administrator can provide the web URL address and credentials to log in and access the features and functions appropriate to your role in your organization’s security operation.
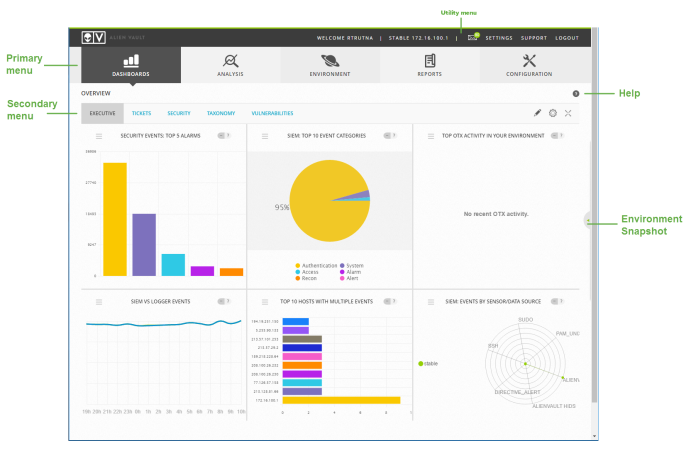
When you first log in, the USM Appliance web UI displays the Executive Dashboard.

By default, the web UI displays a collection of high-level graphs and charts summarizing activity in your organization’s network. From this main window, you can choose different menu options or click other selectable links and buttons.
Callouts on the screen identify the main navigable elements and selections that are provided consistently through the web UI.
- Utility menu — Displays information on the current user and the USM Appliance IP address or hostname. Also provides options to access the Message Center where in-system errors, warnings, and messages are displayed.
- Settings where you can view (and update) user profile information, and view information on current user activity and sessions. The Settings option includes three menus: My Profile, Current Sessions, and User Activity.
- The My Profile menu shows the personal information (login, name, email) of the user who logged into the system.
- The Current Sessions menu lists who is logged into the system. If you are not the administrator, the administrator must grant you permission in order for you to see this list.
- The User Activity menu shows critical actions that were performed by users. See Monitor User Activities for more information on using this option to monitor user activities.
- The Support option lets you access the LevelBlue Success Center, LevelBlue support team tools, and USM Appliance software package downloads. The Support section includes three areas:
- Help — Provides links to the LevelBlue Success Center, to news about the latest releases of USM Appliance, and the Learning Center, where you can find information on how USM Appliance works.
- Support Tools — This option includes the Remote Support tool that you might use when working with the LevelBlue support team. Connecting to Remote Support opens an encrypted connection for LevelBlue Support to diagnose any issues with your LevelBlue system(s). See Remote Support for more information about using the remote support option to diagnose and resolve USM Appliance issues.
- Downloads — This option provides links to software packages for LevelBlue operation.
- Primary menu — Provides access to the main functions or operations of USM Appliance. These include:
- Dashboards — Display of all network security charts, tables, and graphs; deployment status and global of the USM Appliance system, network, and devices; and OTX threat and pulse visualizations.
- Analysis — Display providing search, sorting, filtered selection, and display of Alarms, Security Events (SIEM), Raw Logs, and Tickets.
- Environment — Provides display and management of Assets & Groups, Vulnerabilities, NetFlow data, Traffic Capture, Availability, and Detection.
- Reports — Provides display and management of various built-in and custom reports selectable by categories such alarms, assets, compliance, raw logs, security operations, tickets, and user activities.
- Configuration — Provides options to view and manage deployed USM Appliance components; Administration options let you manage users, system configuration, and backup and restore settings.
- Secondary menu (or submenu) — For each primary menu selection, there are typically additional secondary or submenu options specific to a particular topic that are displayed when you click the primary selection, for example, Analysis > Alarms.
- Help — links to online documentation and topics relevant to the current display and context.
- Environment snapshot — Sidebar display appearing on the right side of the USM Appliance web UI. Unexpanded, the display shows the current alarms and the current Events Per Second (EPS) rate. You can click on the Environment Snapshot tab to expand the display to show more information on open tickets, unresolved alarms, system health, latest event activity, and the number of monitored devices.
The remainder of this guide describes typical best practices in performing common network security operations and provides step-by-step instructions in performing specific tasks. Following sections also describe the USM Appliance web user interface (web UI) from which you can monitor network security and access most USM Appliance security operation features and functionality.
 Feedback