 Role Availability Role Availability
|
 Read-Only Read-Only
|
Investigator |
Analyst
|
Manager
|
USM Anywhere provides a centralized view of your system events Any traffic or data exchange detected by LevelBlue products through a sensor or external devices such as a firewall.. Go to Settings > System Events to see this centralized view.
The System Events page displays information on any events generated within your environment. On the left you can find the Search and Filters options. In the upper-left side of the page, you can see any filters you have applied, and you have the option to create and select different views of the system events. Rows on the main part of the page list individual system events. The following table lists the default columns for system events.
| Column Name | Description |
|---|---|
| Event Name | Name of the event. |
| Time Created | Date and time of the creation of the event. The displayed date depends on your computer's time zone. |
| Sensor |
Name of the USM Anywhere Sensor Sensors are deployed into an on-premises, cloud, or multi-cloud environment to collect logs and other security-related data. This data is normalized and then securely forwarded to USM Anywhere for analysis and correlation. detecting the event. The type of sensor is also displayed below the sensor name. |
| Source User Email | Email of the user that performed the action. For example, when user email@alienvault.com logs in, the source email is email@alienvault.com. |
| Destination User Email | Email of the user that the action is being performed on. For example, if user email@alienvault.com modifies or creates user new@alienvault.com, then the destination email is new@alienvault.com. |
| Event Outcome | Indicates if the action was successful and completed or if it failed. |
| Event Change |
Brief description of what was changed in the system event. It only gets populated for certain actions and indicates what is being changed. Most of these are user changes (for example, when a user is suspended, locked status is reset, multifactor authentication (MFA) is enabled or disabled, or a password is updated). |
| Source Asset An IP-addressable host, including but not limited to network devices, virtual servers, and physical servers. |
Hostname A hostname is a label that is assigned to a device connected to a computer network and is used to identify the device on the network. or IP address of the host Reference to a computer on a network. (with the national flag if the country is known) that initiates the event. Important: If you want to create a rule, use the Source Name or Source Asset ID field instead of using this field. |
| Identity Source Address | IP address of the event or computer that it takes place on. |
Note: System events older than 30 days are cleared from hot storage on a regular basis.
If you want to analyze the data, you can maximize the screen and hide the filter pane. Click the ![]() icon to hide the filter pane. Click the
icon to hide the filter pane. Click the ![]() icon to expand the filter pane.
icon to expand the filter pane.
Click Generate Report to open the Configure Report dialog box. See Create and Schedule Reports for more details.
Click the ![]() icon to bookmark an item for quick access.
icon to bookmark an item for quick access.
You can choose the number of items to display by selecting 20, 50, or 100 below the table.
Configure Columns
Within the page, you can configure the columns and fields that display in the list view. You can also save your configuration settings for later use.
To configure your columns
-
From the
 icon
iconThe Columns

-
Search the columns you want to have in the list view by using the search field.
-
Use the
 and
and  icons to select or deselect from the available columns.
 -
You can order the columns by clicking and dragging the column to the desired place.
- Click Apply.

Note: If you generate a report when you have set custom columns, your report keeps the columns you have configured.
Important: If you want to keep your configuration, you need to save it by selecting Save View > Save As. Otherwise, your custom view is not kept when you move to another feature. See Views for more information.
Note: Only users in the Analyst, Manager, or Investigator roles can configure columns.
Views
USM Anywhere enables you to define and save a custom
You can configure the view you want for the list of items in the page.
To create a view configuration
- From the list view,
- If you want to delimit the search, select the filters you want to apply.
-
Go to Save View > Save As.
The Save Current View dialog box opens.
- Enter a name for the view.
- (Optional.) Select Share View if you want to share your view with other users.
- Click Save.
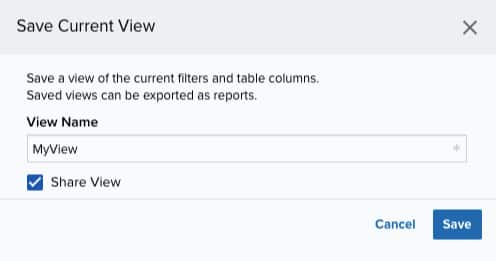
The created view is already selected.
Note: Only users in the Analyst, Manager, or Investigator roles can create a view configuration.
To select a configured view
- From the ist view, click View above the filters.
-
Click Saved Views, and then select the view you want to see.
- Click Apply.
Note: A shared view includes the ![]() icon next to its name.
icon next to its name.
To delete a configured view
- From the
- Click Saved Views, and then click the
 icon next to the saved view you want to delete.
 - Click Accept.
A Settings Delete dialog box opens to confirm the deletion.
Important: The ![]() icon does not display if the view is selected.
icon does not display if the view is selected.
Note:
 Feedback