 Role Availability Role Availability
|
 Read-Only Read-Only
|
 Investigator Investigator |
 Analyst Analyst
|
 Manager Manager
|
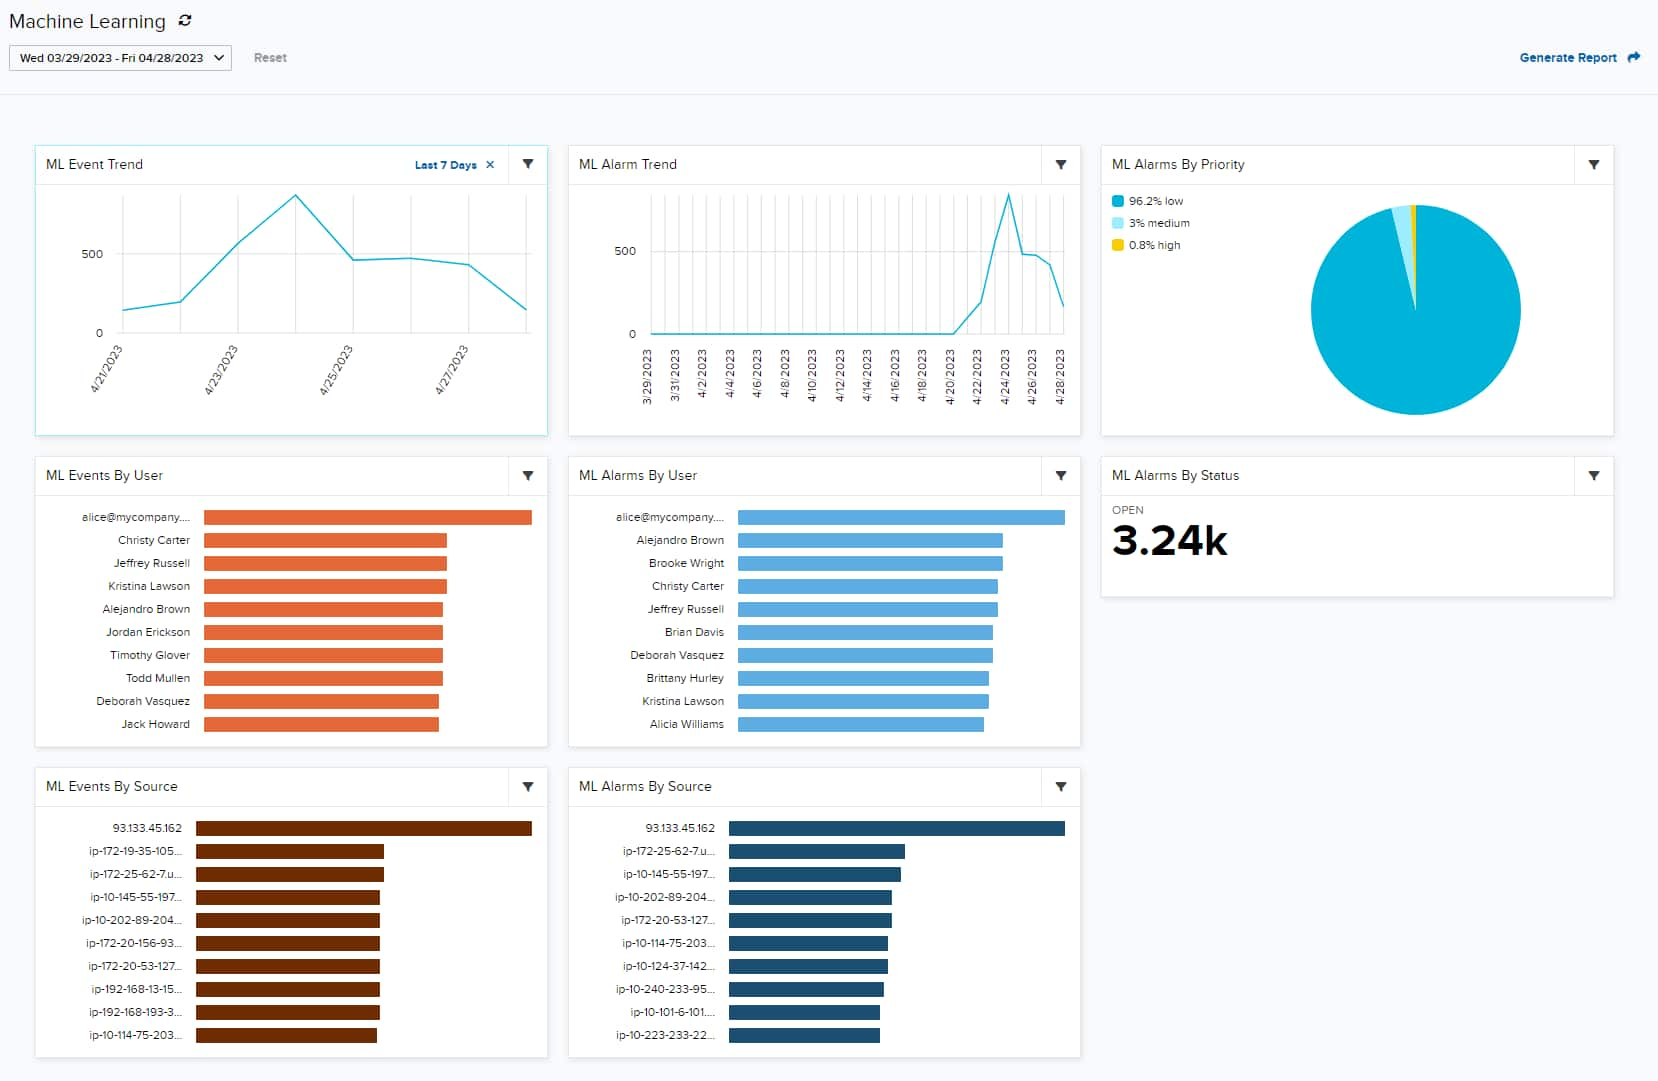
This page of widgets displays information related to the machine learning activity in your environment. Each widget displays event or alarm trends in your USM Anywhere related to your environment's machine learning, as well as events and alarms by user, source, priority, status, and more. By default, each widget displays the last 30 days' trends, but you can filter any widget or the entire dashboard to display trends from a specific timeframe. See Machine Learning for more information.

| Widgets | Description |
|---|---|
| ML Event Trend | Displays a count of events detected by machine learning per hour or per day |
| ML Alarm Trend | Displays a count of alarms detected by machine learning per hour or per day |
| ML Alarms By Priority |
Displays the percentage of machine learning alarms by priority |
| ML Events By User | Displays users associated with the most events detected by machine learning |
|
ML Alarms By User |
Displays users associated with the most alarms detected by machine learning |
| ML Alarms By Status | Displays the number of machine learning alarms by status |
| ML Events By Source | Displays sources associated with the most events detected by machine learning |
| ML Alarms By Source | Displays sources associated with the most alarms detected by machine learning |
 Feedback