 Role Availability Role Availability
|
 Read-Only Read-Only
|
 Investigator Investigator |
 Analyst Analyst
|
 Manager Manager
|
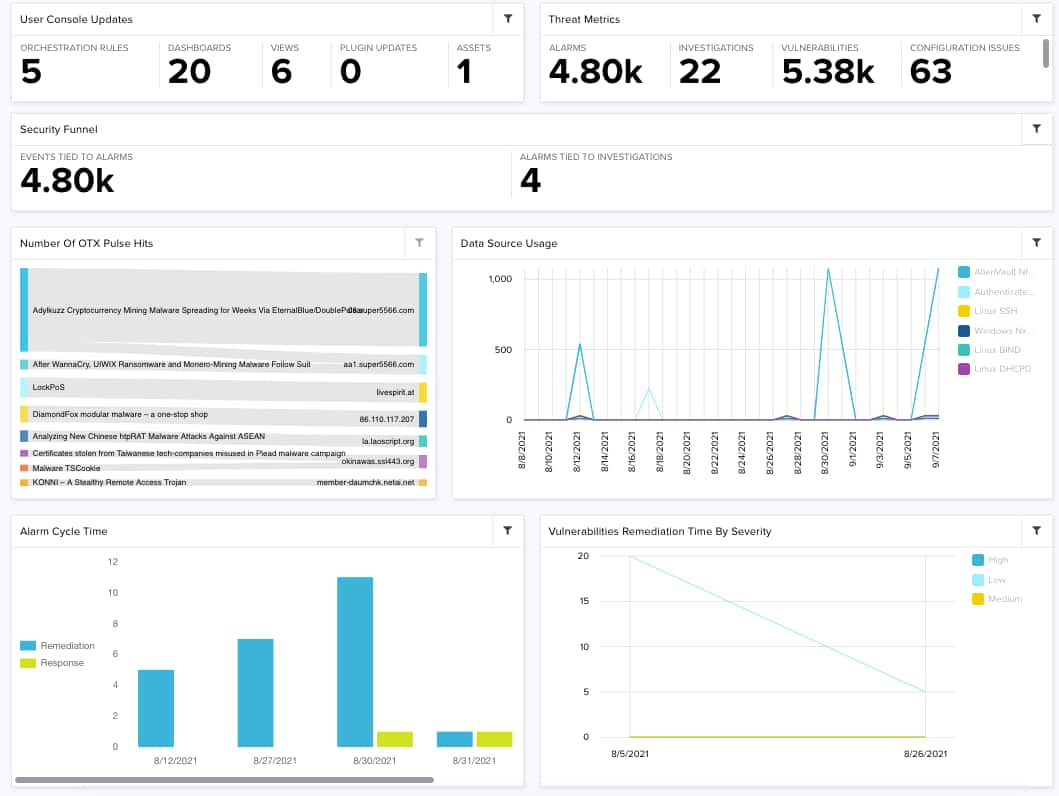
This section shows the related actions that occur in your environment.

| Widgets | Description |
|---|---|
| Platform Updates | Total number of updates that a logged-in user has made on orchestration rules, dashboard, views, plugin updates, and assets. |
| Threat Metrics | Total number of updates that a logged-in user has made on alarms, investigations, vulnerabilities, configuration issues, and users. |
| Security Funnel | Total number of events tied to alarms and the alarms tied to investigations. |
| Number of OTX Pulse Hits | Sankey diagram that displays the top LevelBlue Labs™ Open Threat Exchange® (OTX™) indicators or pulses found on alarms. |
| Data Source Usage | Graph that displays the number of events ingested in USM Anywhere per individual data source. |
| Alarm Cycle Time | Graph that displays the alarm remediation and response. It shows how long it took to respond to a threat and how long it took to resolve the alarm. |
| Vulnerabilities Remediation Time by Severity | Graph that displays the number of open vulnerabilities by severity over time. |
 Feedback