You can view your network configuration through the USM Anywhere Sensor console, allowing you to diagnose your network issues and set a static management IP address.
To set a static management IP address
-
Open your virtualization management console and connect to the USM Anywhere Sensor virtual machine (VM).
Important: Alternatively, you can open an SSH session to the sensor VM. When using an SSH session, the default username is sysadmin.
If you are accessing a Microsoft Azure Sensor through SSH and you specified a username other than the default (sysadmin) for your SSH access, you must use the following commands at the command line to "sudo up" and access the sensor console:# sudo su – sysadmin
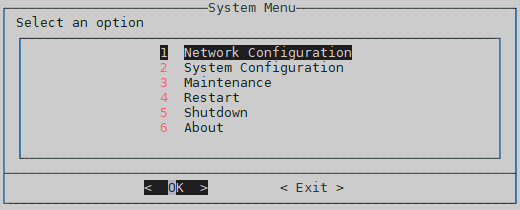
- From the USM Anywhere Sensor console System menu, select Network Configuration and press Enter.
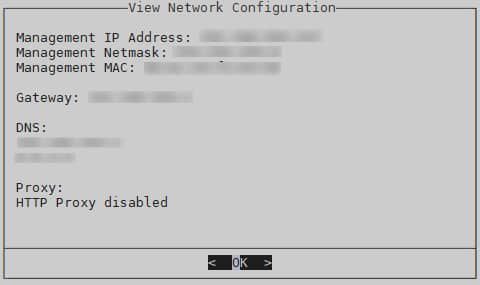
- From the Network Configuration menu, select View Network Configuration and press Enter.
- The system displays the View Network Configuration screen, press Enter.
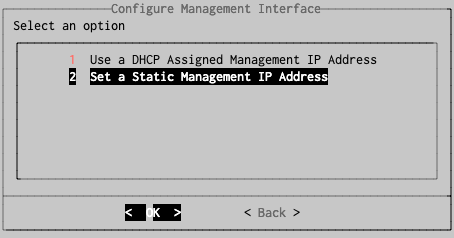
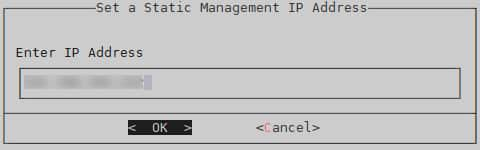
- Select Set a Static Management IP Address and press Enter.
- Enter the IP address and press Enter.
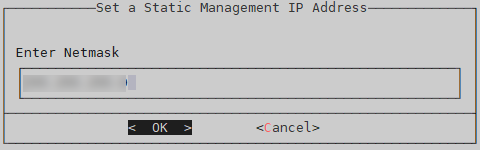
- Enter the netmask and press Enter.
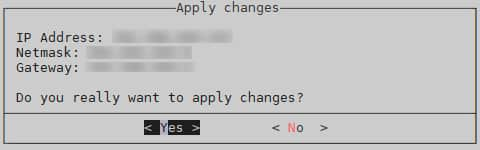
- When a summary of your changes displays, review them for accuracy. Press Enter if they are accurate, or select No to edit your entries.
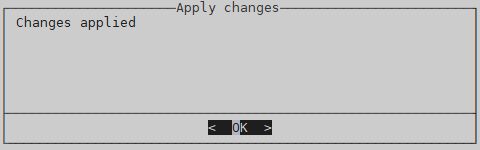
- When your changes have been applied the system will display a message saying 'Changes applied'. Press Enter.
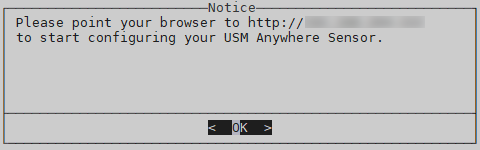
- After the system displays a notice to configure your USM Anywhere Sensor, press Enter.

To see other options of the Network Configuration menu
- From the USM Anywhere Sensor console System menu, select Network Configuration and press Enter.
- From the Network Configuration menu, select Configure Management Interface and press Enter.
- Go back to the Network Configuration menu, select Configure DNS, and press Enter.
- Go back to the Network Configuration menu, select Configure Proxy, and press Enter. This is for an HTTP port 80 proxy. LevelBlue recommends not to create one.
- Go back to the Network Configuration menu, select Configure ERSPAN Interface, and press Enter.
The management interface is the primary IP address used to connect to a sensor node. The user sets this IP when the sensor node virtual image is created. This value doesn't change unless, after created, you set it with Dynamic Host Configuration Protocol (DHCP). LevelBlue recommends that all sensors are configured with a static IP address and that you not change the value.
This option displays the current Domain Name System (DNS) server settings for the sensor. Use this option to modify them. You can specify a primary and secondary DNS server.
See Configure USM Anywhere to Receive ERSPAN Traffic for more information.
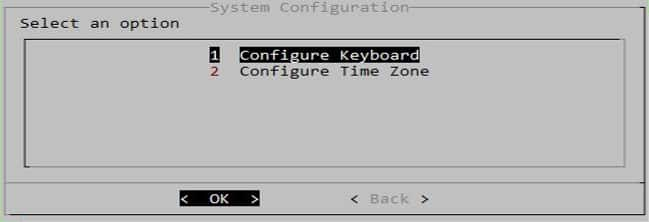
System Configuration
This option enables you to configure the sensor keyboard layout and the sensor working time zone.
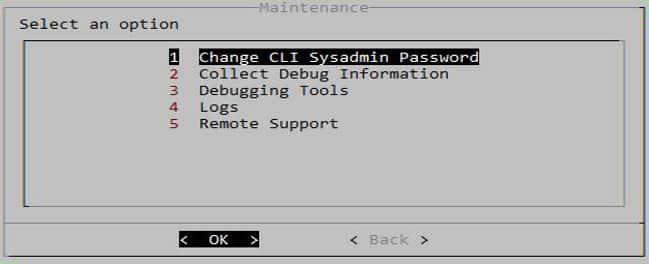
Maintenance
The Maintenance menu includes several useful options that enable you to perform debug and research of the sensor node.
You always access to the sensor using the sensor username of “sysadmin”. There is no access to the sensor node command line and no user access to a "root"-level username. The initial password is set when the sensor node is created and initially configured. Be extremely careful to save this password. There is no “Forgot Password” function available for sensor access. If the password is lost or forgotten, a sensor redeploy action is the only possible recovery.
Important: This option is not displayed for Amazon Web Services (AWS) Sensors. These sensors must use AWS console actions to these modifications.
This option enables you to gather and download all of the debug logs created and that are available on a sensor node. When you select this option, you will see several new views. The first is a verification of the debug data request.
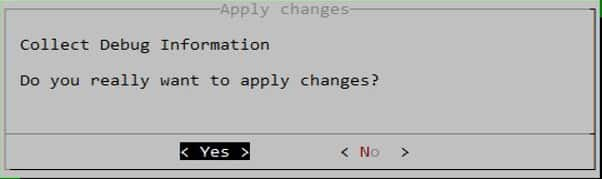
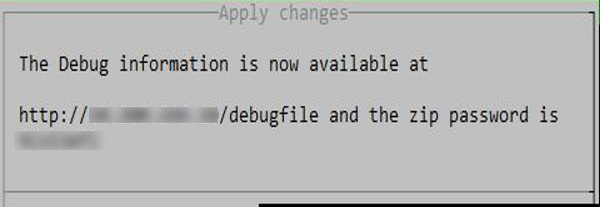
If you enter “No”, the panel escapes back to the previous panel view. If you enter “Yes”, the sensor will operate to collect the debug files into a password protected zip format file. When it finishes, the new panel displays to collect the file. You need the password to extract the data.
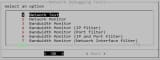
The user interface (UI) comes packaged with useful system level and networking level debugging tools to assist with diagnosing sensor node problems. Use these tools for internal sensor troubleshooting. This information can be different than what is seen in the management consoles of the different sensor types. These are the debugging tools:
- System Debugging Tools: The “System” selection uses standard system-level diagnostic tools, like htop. After a confirmation screen is displayed, you will see the output of the tool. As noted in the screens, use “q” or “F10” to revert back.
-
Network Debugging Tools: The Networking Debugging Tools UI view displays available tools to monitor network traffic on the sensor.
-
Network Test: This option performs several probing commands to verify sensor connectivity to needed external servers and ports. If there are external connectivity issues, this option will display them.
-
Network Monitor: This option displays network traffic between server endpoints associated with the sensor.
-
Bandwidth Monitor: This option displays all endpoint network activity with IP address and port information. For each entry, it shows BPS data for transmits, receipts, and total activity.
-
Bandwidth Monitor With Filtering: These options enable you to target filtering of the data based on the filter type noted in the option. When selected, a new panel displays to set the values for the filter.
-
Ping: This option enables you to test the reachability of a given endpoint. This does not guarantee that the required TCP ports are open to allow connectivity (see Dig below).
-
Dig: This option enables you to find the IP address of a given endpoint using its FQDN (such as prod-usm-saas-tractorbeam.alienvault.cloud). Then, you can use that IP address and Ping or the TCP connection test with a port number to test the reachability and connectivity to the endpoint, respectively.
-
TCP Connection Test: This option enables you to test the TCP connection for successful data transmission to a given endpoint using an IP address and a port number.
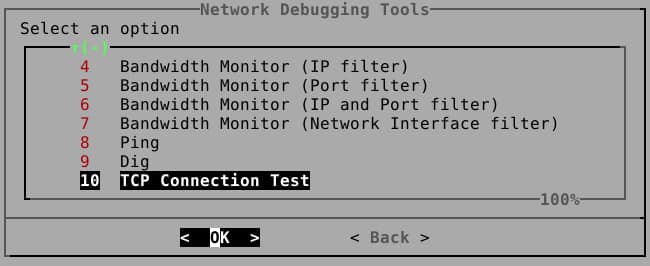
These are the Network Debugging Tools:
When deep packet inspection (DPI) is implemented, this TCP Connectivity test may still succeed while the secure connection to the endpoints fails.
See View Network Testing Information for more information.
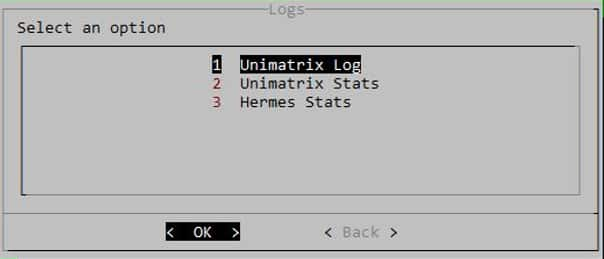
This option enables you to access a read-only view of three debug logs being captured on the sensor node. A confirmation view pane is displayed ahead of the data. The unimatrix, unimatrix-stats, and hermes stats logs are part of the Debug Logs zip file. The zip file may contain additional log files of the same data in compressed "gz" format. When the active file grows to its maximum size, the file is compressed, given a numerically tagged new name, and a fresh log file created.
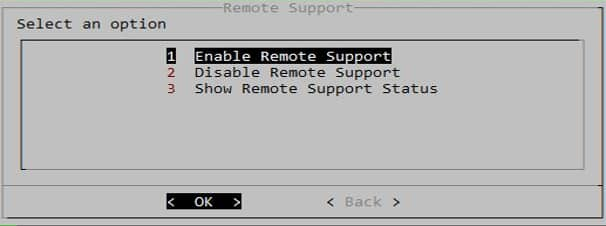
As needed, LevelBlue Technical Support may require access to the sensor node for research and debug purposes. It does so through a special outbound portal that must be initiated by the user through this option. To perform this action, ports 22 and 443 must be open.
Restart
This option does a reboot and restart action on the sensor node.
Shutdown
This option performs a graceful shutdown of the sensor node image.
About
This option displays the current running sensor version. It should match the version running on the Control Node. If not, this can cause side effects on how the sensor node interacts with the control node.
Exiting the Sensor UI View
When all activity is completed, exit from the UI by selecting the Exit option from the main screen. This logs off users from the sensor node.
 Feedback