This blog was written by an independent guest blogger.
Reversing binaries is an essential skill if you want to pursue a career as exploit developer, reverse engineer or programming. The GNU Project debugger is a widely used debugger for debugging C and C++ applications on UNIX systems. A debugger is a developer's best friend to figure out software bugs and issues.
This tutorial intends to be beneficial to all developers who want to create reliable and fault-free software.
A debugger executes several programs and allows the programmer to manage them and analyze variables if they cause issues.
GDB enables us to execute the program until it reaches a specific point. It can then output the contents of selected variables at that moment, or walk through the program line by line and print the values of every parameter after every line executes. It has a command-line interface.
Let's understand GNU debugger with an example
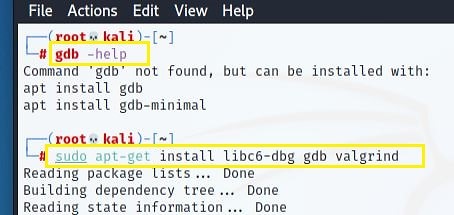
To install the GDB in the Linux system, type in the command to install GDB.
The code I am using for an example here is calculating factorial numbers inaccurately. The aim is to figure out why the issue occurred.
#include
|
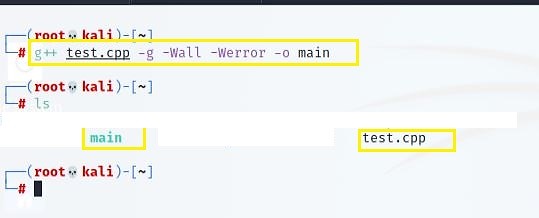
GCC is a Linux compiler that comes pre-installed in Linux. Use the "g++" command to convert the source code "test.cpp" into an executable "main." Use "-g flag" so you can debug the code later as well.
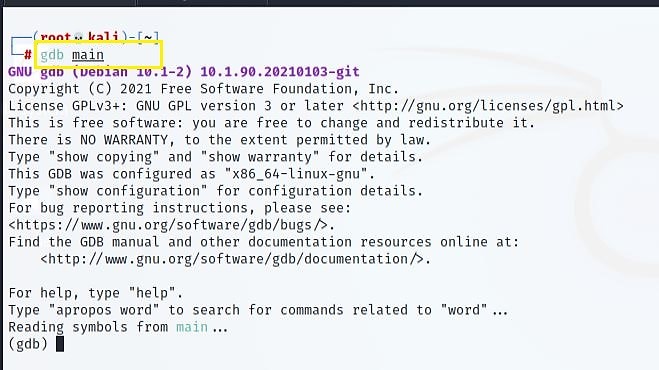
Start the GDB with the executable filename in the terminal.
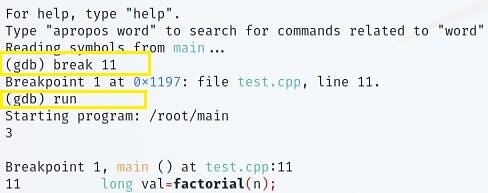
You'll likely wish the code to stop at one stage so you can assess its status. The breakpoint is the line where you desire the code to halt momentarily. In this scenario, I am setting a breakpoint on line 11 and running the program.
The commands "next" and "step" in GDB execute the code line by line.
- The Step command monitors the execution via function calls.
- The Next command keeps control only in the current scope.
Using “watchpoints” is akin to requesting the debugger to give you a constant stream of information about any modifications to the variables. The software stops when an update happens and informs you of the specifics of the change.
Here, we set the watchpoints for the calculation's outcome and the input value as it fluctuates. Last, the results of the watchpoints are analyzed to identify any abnormal activity.
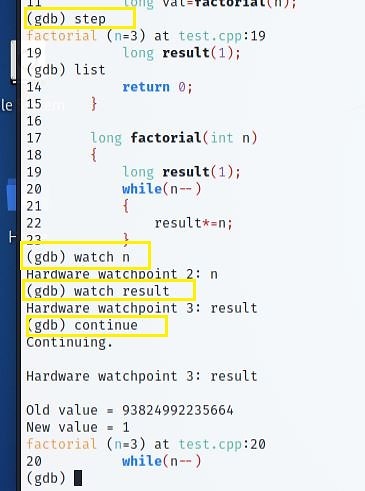
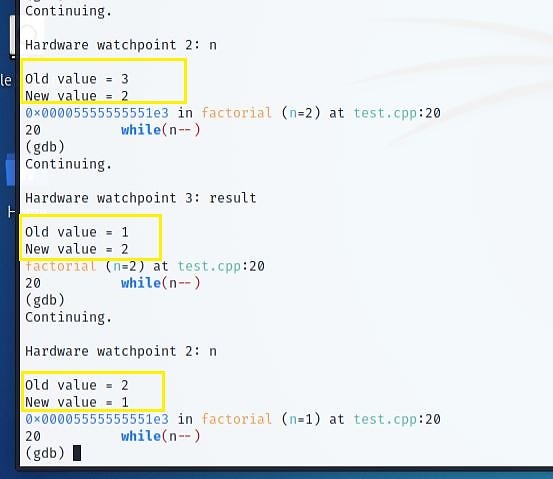
Notice the result in "old" and "new" values. To continuously notice the shift in values, press the Enter key.
Notice that "n" instantaneously reduces from 3 to 2.
By multiplying the previous value of the result by the "n" value, the result now equals 2. The first bug has been spotted!
It should assess the outcome by multiplying 3 * 2 * 1. However, the multiplication here begins at 2. We'll have to alter the loop a little to fix that.
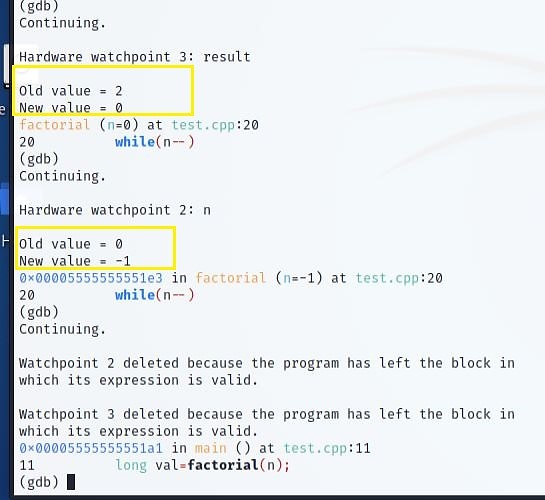
The result is now 0. Another bug!
So, when 0 multiplies with the factorial, how can the output keep the factorial value? It must be that loop halts before "n" approaches 0.
When "n" values shift to -1, the loop may not execute anymore. Next, call the function. Notice when a variable is out of scope, watchpoint deletes it.
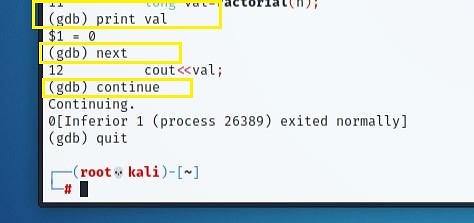
Examining local variables to determine whether anything unusual has happened might help you locate the problematic section of your code. Since GDB refers to a line before it runs, the "print val" command returns a trash value.

Last, the error-free code would look like this.
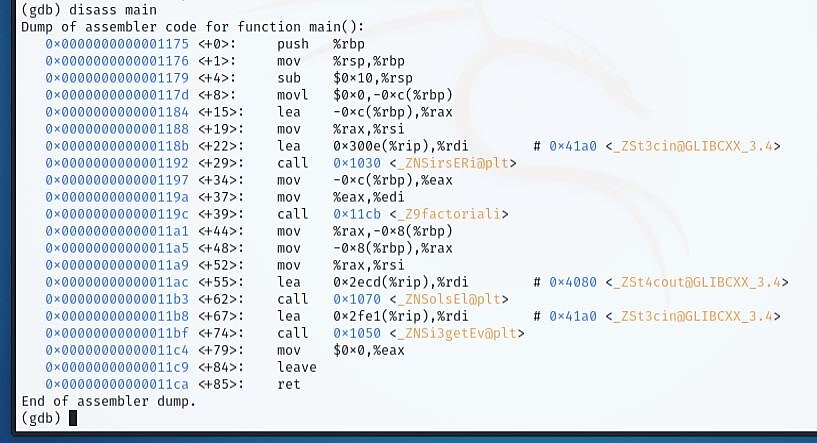
To fully comprehend what the debugger is doing, examine the assembly code and what is happening in memory.
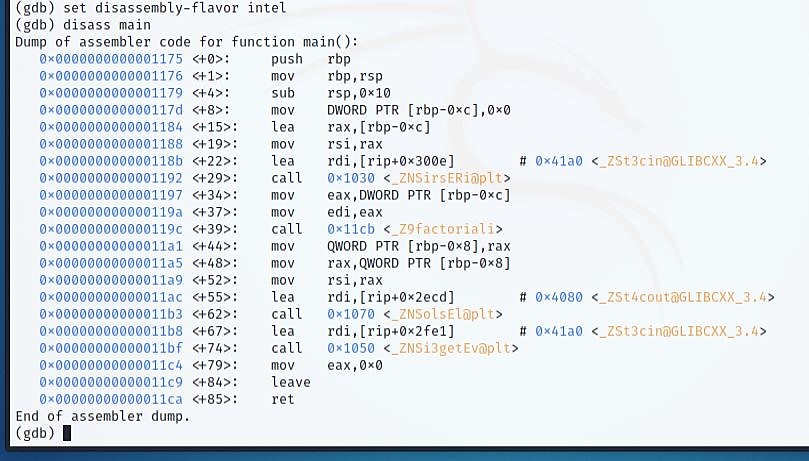
Use the "disass" command to output the list of Assembly instructions. GDB's default disassembly style is AT&T, which might perplex Windows users as this style is for Linux. If you don’t prefer this, the disassembly style can be re-set as well.

Execute the "set disassembly-flavor
The logic flow is critical to the success of any program. The flow of Assembly code can be simple or complicated, based on the compiler and settings used during compiling.
|
|
In a nutshell
After finishing this tutorial, you should have a solid knowledge of using GNU Debugger to debug a C or C++ programs.
We took an example of C++ code and tried a few things with GDB. But if you want to explore it further, use the "help" option in the "(gdb) interface."